Report
Providentia’s report mode was designed to be able to generate complete PDF reports, allowing in-depth analysis of model output, with respect to observational data.
Getting started
To start your report, simply add --report or --reports as a launch option along with the mandatory configuration file on the command line:
./bin/providentia --config=/path/to/file/example.conf --report
./bin/providentia --config=/path/to/file/example.conf --reports
The report mode fetches all the content specified in your configuration file across all sections. To only run one specific section, add the --section parameter to the command.
Report configuration fields
All parameters that can be used in the report configuration files can be found in the Shared Parameters, Analysis and Visualization Parameters or Report Parameters sections of the Configuration Fields page.
Plot types and options
The report mode has access to a larger variety of plot types than the standard interactive version of Providentia. Each available plot type for the reports is listed in Plot types and options.
Plot selection
The plots that are defined to be visualised in the report can be set via the plots variable in 2 ways.
They can be set in the form of a list, (e.g. plots = timeseries, distribution, statsummary), or the name of a preset group of plots from settings/report_plots.yaml (e.g. standard). Preset names cannot take the name of a plot type (e.g. timeseries).
Each plot can be defined with valid plot options via the _option suffix (e.g. taylor_perstation), and/or a -stat suffix to select a statistic where the plot supports one (e.g. periodic-r).
The plots will appear in the report in the defined plot order, with the exception of multispecies plots, which will appear first.
Summary and station plots
Users can specify if they want to see the plots as a summary for all the stations or per station. This is set through the parameters report_summary and report_stations.
When a report has multiple subsections, summary plots will show data per subsection and data label, and station plots will show only data per label.
There is also the possibility to create some plots per station, and some only as a summary by using dictionaries in settings/report_plots.yaml. For instance, in the following example we would be creating timeseries station plots and scatter summary plots.
"new_plots": {"station": ["timeseries", "timeseries_annotate"],
              "summary": ["scatter", "scatter_annotate"]}
Cover page
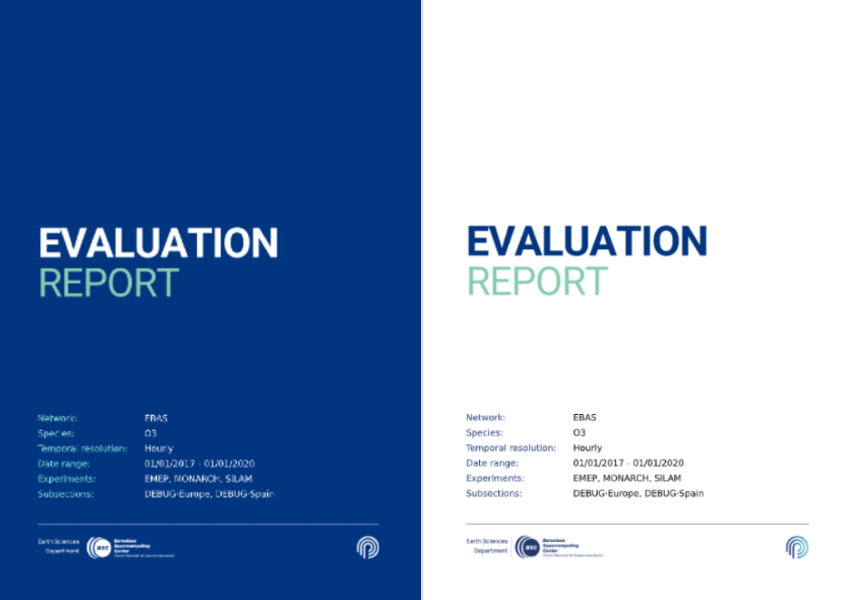
The cover page can be customised by editing the parameters under header in settings/plot_characteristics.yaml file. The most interesting ones are these:
dark_modeto set the background to be dark (blue tone) or light (white).variablesto specify which variables you want to show. The options arenetwork,species,resolution,dates,model,temporal_colocation,spatial_colocation,filter_species,calibrationandsubsections. By specifying thevalueunder those keys, you can overwrite the default variable values and write anything you want.logoto display any logo on your report cover. To use it, you must specify the path to your PNG file for the corresponding background (dark or light mode).
DOIs pages
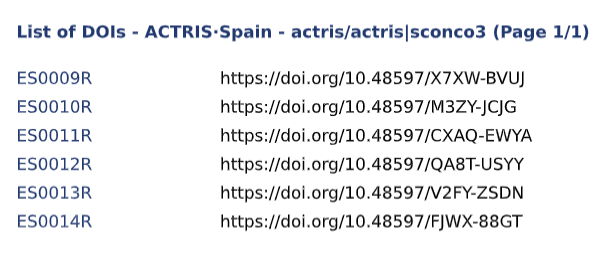
When reading ACTRIS data, pages including the DOIs of the original datasets will be shown at the end of the report. Up to 30 references will be shown per page, depending on the chunk_size in settings/plot_characteristics.yaml.